Early Vote Analysis for Sunday, Nov. 1
more:Early Vote Analysis for Sunday, November 1st
Original Post
 www.newsweek.com
pretty interesting information. I definitely want to see how things look by October 16th this year.
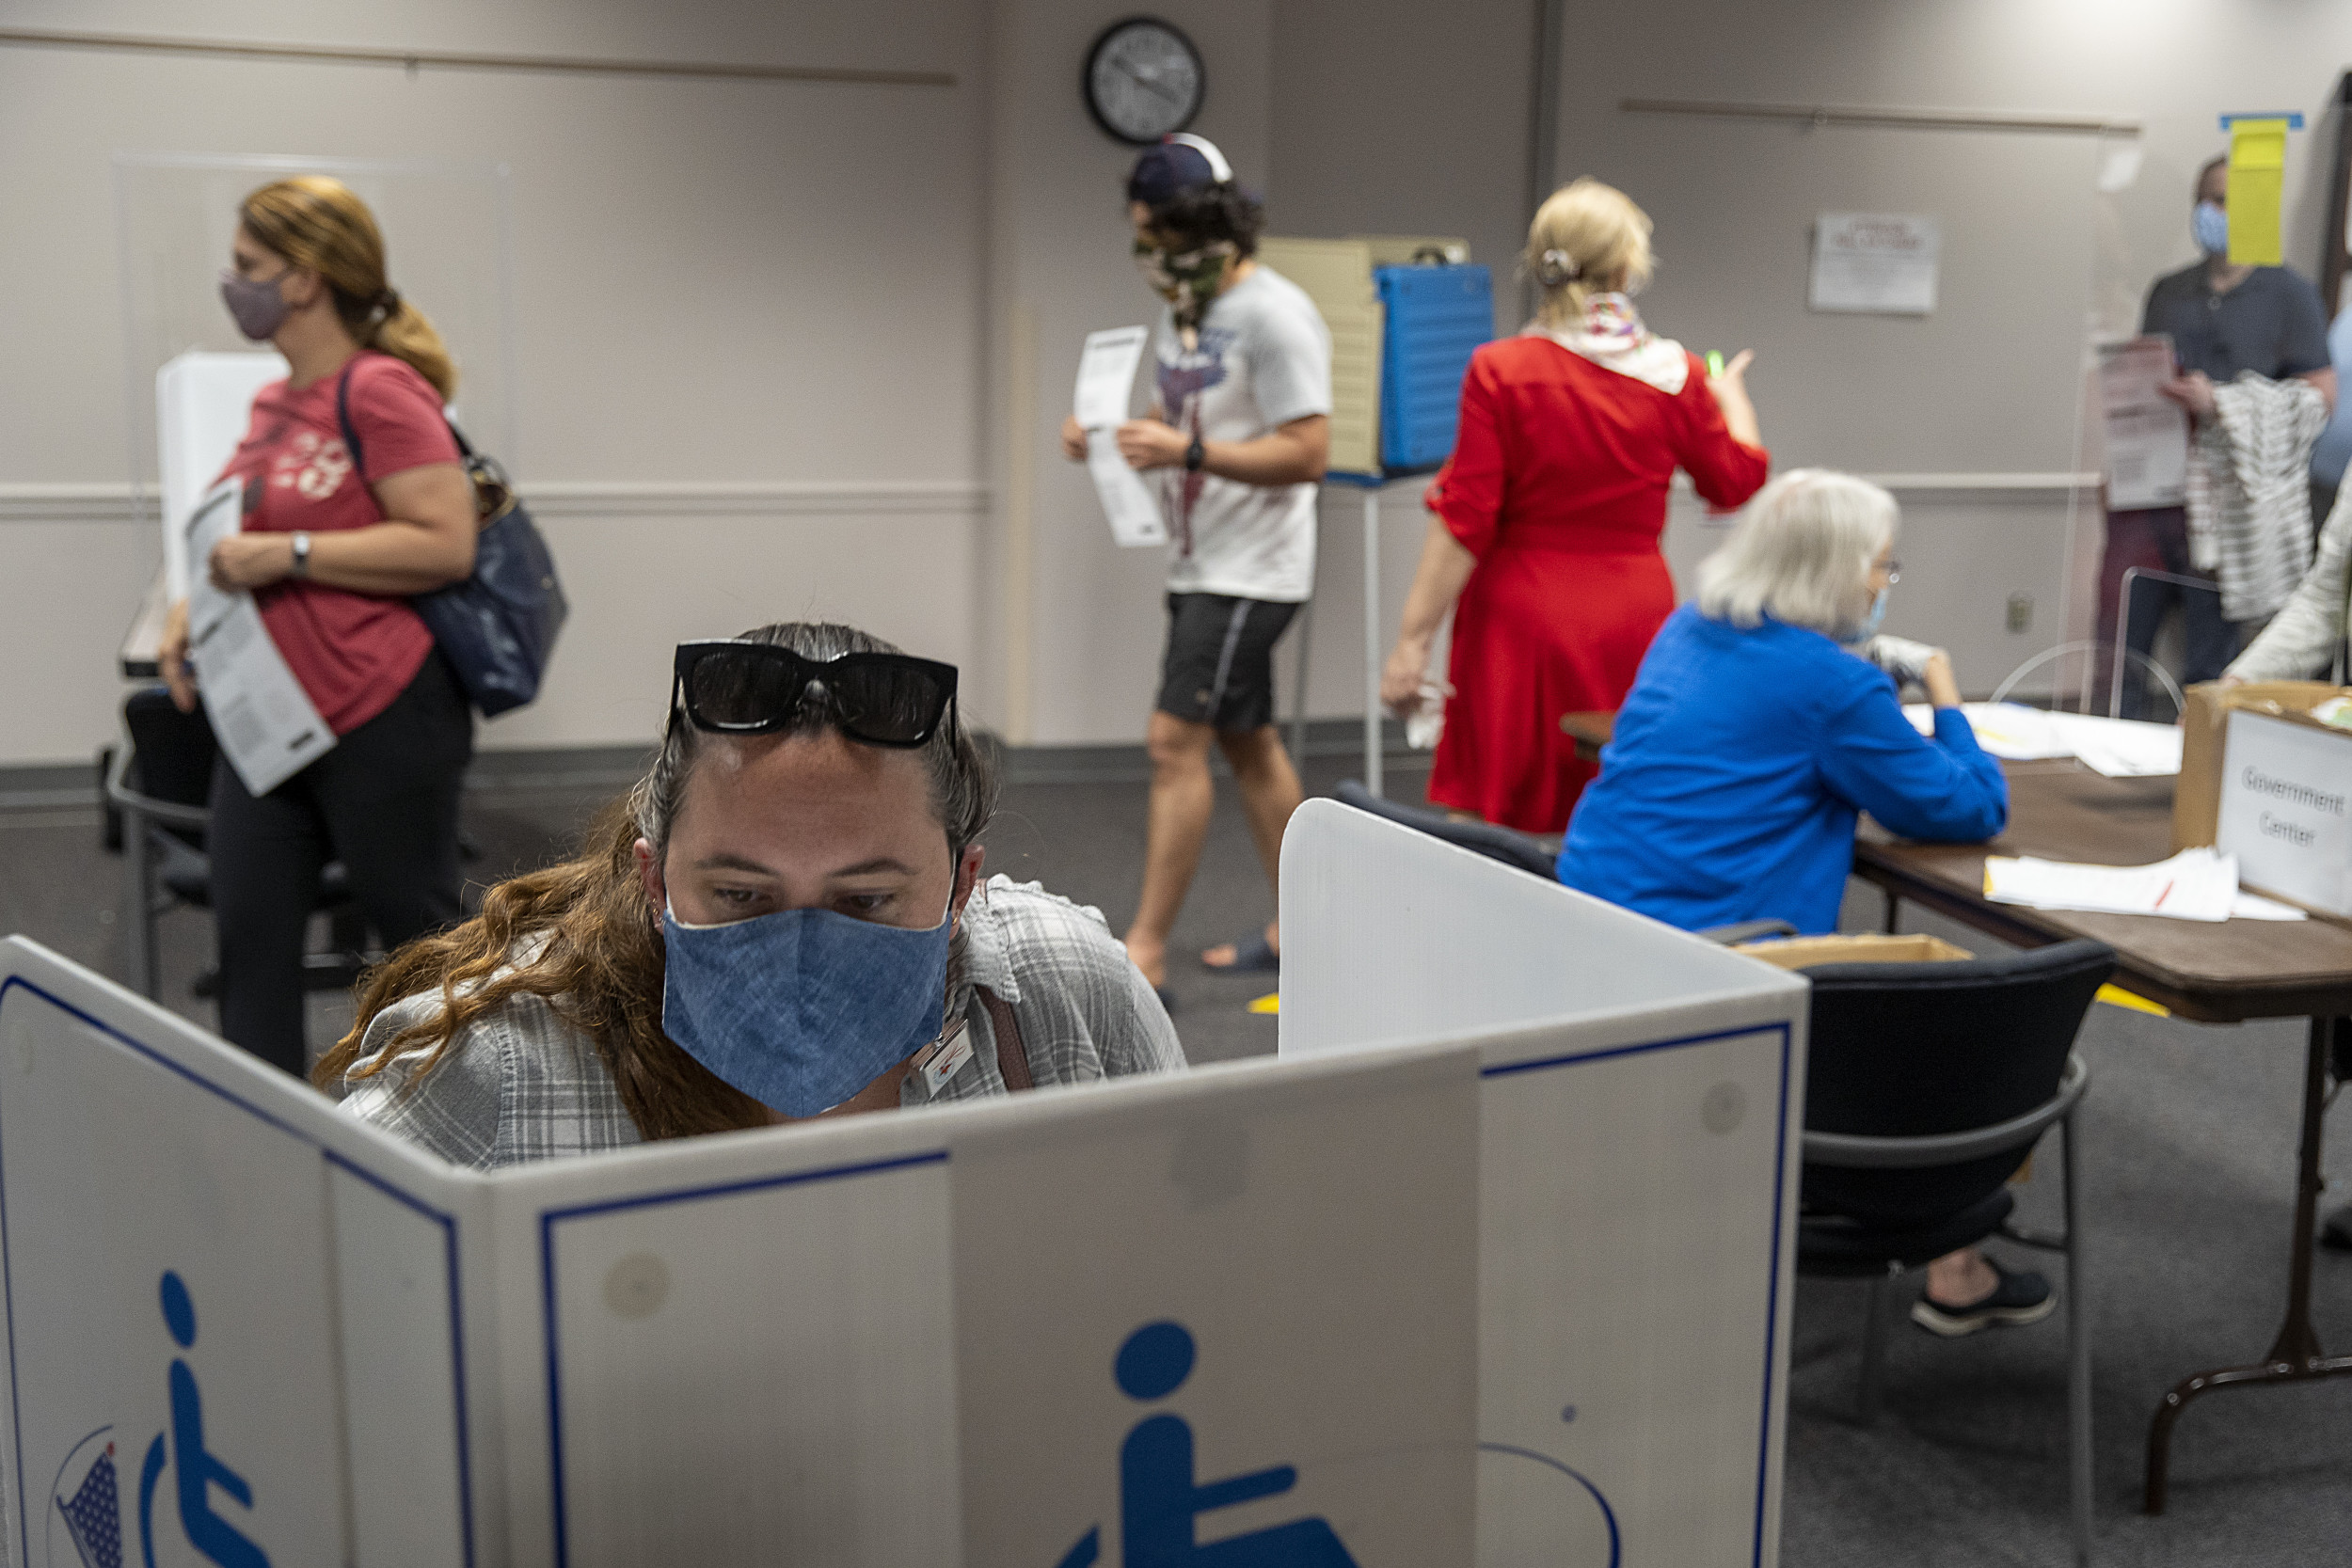
snapshot of early voters
Big Note
Voters have requested a total of 63,978,880 ballots in the reporting states.
states who report party data.
When early voting starts
NOWSept. 18 - Minnesota, South Dakota and Wyoming
NOWSept. 19 - New Jersey and Virginia
NOWSept. 21 - Michigan and Vermont
NOWSept. 24 - Illinois
NOWOct. 4 - Maine
NOWOct. 5 - California, Iowa, Montana and Nebraska and South Carolina
NOWOct. 6 - Indiana and Ohio
NOWOct. 7 -- Arizona
NOWOct. 12 - Georgia
NOWOct. 13 - Texas
NOWOct. 14 - Kansas and Tennessee
NOWOct. 15 - North Carolina
NOWOct. 16 - Washington,Louisiana
NOWOct. 17 - Massachusetts, Nevada and New Mexico
NOWOct. 19 - Alaska, Arkansas, Idaho, North Dakota and Some Florida Counties(see news article)
NOWOct. 20 - Utah and Wisconsin
NOWOct. 21 - West Virginia
NOWOct. 24 - New York
NOWOct. 26 - Maryland
NOWOct. 27 - District of Columbia
NOWOct. 29 - Oklahoma
It appears likely that around 100 million early votes will be cast by the time Tuesday morning reports are processed. These reports will include early voting activity from the proceeding day. It is also likely reports by Tuesday morning will fail to capture all of the pre-election voting activity since there are sporadic reports of election officials experiencing delays in processing the unprecedented number of mail ballots. Furthermore, many states continue to accept mail ballots if they are postmarked on or before Election Day, as noted in this New York Times article. This report does not accurately describe mail ballot return deadlines for military and overseas civilian voters, which can be later than domestic voters.
What does this mean for overall turnout, including Election Day voters?
Before answering this question, let me first reiterate something very important about how to make forecasts with these data. The approach I use is known as difference-in-difference. In the election context, this technique makes a comparison to a past comparable election and then forecasts based on the current election.
For example, in 2016 40% of the vote was cast early (this is a reasonable estimate of all early voting activity in 2016). If nothing changed, knowing the current estimate of 100 million early votes we could forecast 100 million/40% = 250 million votes will be cast in the election. Now, that is a ridiculously high number and we will not come close since it would be higher than the 239 million people I estimate are eligible to vote!
The obvious reason why an estimate of 40% of the vote will be cast early is wrong is that something changed. The difference-in-difference approach works best where there is a good comparison point. Does this mean that things are so different than 2016 that we cannot know anything from the early vote? No. There are some states where there is a good past comparison because they did not change their elections significantly or where we can make educated guesses about what the early vote is telling us relative to 2016.
One strong signal is that turnout will be higher than in 2016, because some states have already exceeded their 2016 turnout or are close to doing so.
I know you could care less about a turnout prediction. What you really want to know is who will win.
For the most part, the clues come from states that have party registration. The difference-in-difference approach can be applied by examining the difference in the percentage of early voters in 2016 registered with the Democratic and Republican Parties and comparing the party registration difference to 2020.
The caveats that apply to forecasting turnout, also apply to forecasting who will win, with an additional caveat:
Surveys are the best source of this latter information. For those who say surveys are the only source for forecasting election outcomes, I would point out that some survey samples are drawn from lists of registered voters and are weighted to party registration breakdowns. These pollsters implicitly believe there is value to party registration data.
- We cannot know with certainty the vote preferences of registered Democrats, Republicans, or non-affiliated voters.
I believe that the party registration breakdowns of early voters can provide clues not only to the partisan composition of the electorate, but also to the relative enthusiasm of Democrats and Republicans to vote. If there is an electoral swing towards a candidates of a political party, some of that swing should be evident in relative enthusiasm to vote (early).
Again, the big caution is that early voting has changed so much from 2016 in many states, that there is no good past comparison; a key assumption of the difference-in-difference approach.
There are certain states that did not change the way they run their elections: the all-mail ballot states. Let's start with analyzing three in particular: Colorado, Oregon, and Nevada (which had a large amount of early vote in 2016). These provide us with the best 2016 comparison.
If much concern to Democrats are all the mail ballots that have yet to be returned. These should be of concern, but I want to put these statistics in context.
As of this writing, there are 31,958,869 outstanding mail ballots that have not been entered as returned by election officials.
There are many unknowns with the outstanding mail ballots, so it is difficult to take these numbers at face value.
Factors in favor of the outstanding mail ballots being an over-count:
Factors in favor of the outstanding mail ballots being an under-count:
- Some mail ballots are in transit.
- Some states continue to accept mail ballots if postmarked by Election Day.
- Some are at election offices but have not been entered into their databases.
- It is unclear how election officials manage data for voters who requested a mail ballot, but decided to cast an in-person vote.
Election officials in many states have never had to process so many mail ballots, so reporting delays and inconsistencies in reporting are understandable. When there were only tens of thousands of mail ballots statewide in some of these states, it was relatively easy to process the ballots and no one really cared about the few where someone may vote in-person. Increase the workload by two orders of magnitude, and delays will happen. Add to this the uncertainties with the post office driving more people to decide to vote in-person. We're making do in tough times with a poorly-funded election infrastructure in many places.
- Some states do not report mail ballot applications or the number of ballots sent; Texas probably being the largest of these states.
- Although not affecting the total number, the mail ballot return rate is too high in states where in-person votes are co-mingled with mail ballots; states like Iowa, among others.
more:Early Vote Analysis for Sunday, November 1st
Original Post
At least 866,734 people have voted in this year's election as of September 26, according to the U.S. Elections Project, which is run by University of Florida political science professor Michael McDonald. The number is based on 25 states whose early voting data is available, meaning it does not convey the entire picture.
"These states are those where I have current data on mail ballot activity," McDonald wrote in a blog post Saturday morning. "More states will be added as state reports become available."
While it is important to note that this number is only an estimate and could've been higher depending on whether McDonald had access to more states' data, the difference of more than 850,000 votes from this time in 2016 is astonishing.
As McDonald acknowledged in a blog post written at the time, the pace of early voting will naturally increase as Election Day draws nearer and more people finalize their choices. Just one week later—on October 2, 2016—at least 78,836 people had cast their ballot early in the reporting states, McDonald found. By October 16, 2016, that number had increased even further to be around 1.4 million voters.
Over 860,000 Have Voted in U.S., Compared to 9,500 by This Point in 2016
The reported number is a sign of Americans' excitement for the upcoming election, as well as an increased commitment to voting early fueled by the coronavirus pandemic and concern over the U.S. Postal Service.
www.newsweek.com
pretty interesting information. I definitely want to see how things look by October 16th this year.
snapshot of early voters
Big Note
Voters have requested a total of 63,978,880 ballots in the reporting states.
states who report party data.
When early voting starts
NOW
NOW
NOW
NOW
NOW
NOW
NOW
NOW
NOW
NOW
NOW
NOWOct. 15 - North Carolina
NOW
NOW
NOW
NOW
NOW
NOW
NOWOct. 26 - Maryland
NOWOct. 27 - District of Columbia
NOWOct. 29 - Oklahoma
Last edited: