It's a fair bit more than what I expecetd based on its position this week. But that represents maybe what, 3% of its LTD?
PAL Charts - Week 19, 2019
- Thread starter Bruno MB
- Start date
You are using an out of date browser. It may not display this or other websites correctly.
You should upgrade or use an alternative browser.
You should upgrade or use an alternative browser.
Vandal.net announced they have now digital sales data.
Spain:
Week 18, 2019 - Individual Formats Retail (Units) (Source: Vandal.net)
01 (01) PS4 Days Gone - 12.000 / 38.600
02 (06) NSW Mario Kart 8 DX - 4000 / 371.000
03 (02) PS4 FIFA 19 - 2600 / 629.900
04 (NE) NSW Final Fantasy XII The Zodiac Age - 2000 / NEW
05 (04) PS4 Grand Theft Auto V - 2000 / 919.200
06 (05) PS4 Spider-Man - 1900 / 294.300
07 (08) NSW Super Smash Bros Ultimate - 1600 / 135.600
08 (02) PS4 Mortal Kombat 11 - 1600 / 8000
Days Gone has 21% digital ratio, while PS4 Mortal Kombat 11 digital ratio is 22%.
So, these are the totals after two weeks (retail + digital).
Days Gone: 48,860
Mortal Kombat 11 PS4: 10,250
Other digital ratios: God of War - 19%, Mortal Kombat 11 XB1 - 29%, Mortal Kombat 11 PC - 97%, The Division 2 PS4 - 37%, The Division 2 XB1 - 46%.
In the podcast of Vandal they said God of War and The Division 2 are the extremes with the data they have now. Average could be between 21% and 24%.
Edit: corrected the digital ratio of The Division 2 XB1, it is 46%, not 36%.
Last edited:
Vandal.net announced they have now digital sales data.
Days Gone has 21% digital ratio, while PS4 Mortal Kombat 11 digital ratio is 22%.
So, these are the totals after two weeks (retail + digital).
Days Gone: 48,860
Mortal Kombat 11 PS4: 10,250

Thanks for this, very interesting !Vandal.net announced they have now digital sales data.
Days Gone has 21% digital ratio, while PS4 Mortal Kombat 11 digital ratio is 22%.
So, these are the totals after two weeks (retail + digital).
Days Gone: 48,860
Mortal Kombat 11 PS4: 10,250
Other digital ratios: God of War - 19%, Mortal Kombat 11 XB1 - 29%, Mortal Kombat 11 PC - 97%, The Division 2 PS4 - 37%, The Division 2 XB1 - 36%.
In the podcast of Vandal they said God of War and The Division 2 are the extremes with the data they have now. Average could be between 21% and 24%.
Updated Days Gone numbers with digital Loudninja ;)
Vandal.net announced they have now digital sales data.
Days Gone has 21% digital ratio, while PS4 Mortal Kombat 11 digital ratio is 22%.
So, these are the totals after two weeks (retail + digital).
Days Gone: 48,860
Mortal Kombat 11 PS4: 10,250
Other digital ratios: God of War - 19%, Mortal Kombat 11 XB1 - 29%, Mortal Kombat 11 PC - 97%, The Division 2 PS4 - 37%, The Division 2 XB1 - 36%.
In the podcast of Vandal they said God of War and The Division 2 are the extremes with the data they have now. Average could be between 21% and 24%.
Interesting that MK11 didn't skew much differently in digital share from DG as expected due to multiplayer vs single player. I suspect most MK players play local co-op or single player.
Also PS4 and X1 digital shares are about the same for the games shown. I would of expected the X1 to be greater especially in Spain with such a small hardcore userbase.
You are right. I was editing my message while you were writing because the 36% for The Divsion 2 XB1 was not correct. It is 46%. :-)
Oh my.You are right. I was editing my message while you were writing because the 36% for The Divsion 2 XB1 was not correct. It is 46%. :-)
That FIFA 19 Switch numbers is quite remarkable considering the game debuted at 8k on Switch. That's almost a tenfold increase over its first week performance. Anyone have numbers for how that stacks up to the XB1 version (which debuted at 14k) and the PS4 version (which debuted at 210k)?
The Switch version probabily sold more than the XBO version considering the situation of Xbox one in Spain.
Vandal.net announced they have now digital sales data.
Days Gone has 21% digital ratio, while PS4 Mortal Kombat 11 digital ratio is 22%.
So, these are the totals after two weeks (retail + digital).
Days Gone: 48,860
Mortal Kombat 11 PS4: 10,250
Days Gone has taken on a life of its own.
Fantastic sales for Days Gone In Spain.Vandal.net announced they have now digital sales data.
Days Gone has 21% digital ratio, while PS4 Mortal Kombat 11 digital ratio is 22%.
So, these are the totals after two weeks (retail + digital).
Days Gone: 48,860
Mortal Kombat 11 PS4: 10,250
Other digital ratios: God of War - 19%, Mortal Kombat 11 XB1 - 29%, Mortal Kombat 11 PC - 97%, The Division 2 PS4 - 37%, The Division 2 XB1 - 46%.
In the podcast of Vandal they said God of War and The Division 2 are the extremes with the data they have now. Average could be between 21% and 24%.
Edit: corrected the digital ratio of The Division 2 XB1, it is 46%, not 36%.
I didn't forget you :p
So here is a chart of the top 10 games that released in 2018 :
- FIFA 19 (PS4) : 629 000
- Red Dead Redemption 2 (PS4) : 407 000
- Spiderman : 294 300
- Call of Duty Black Ops 4 (PS4) : 249 000
- Pokemon Let's Go : 189 000+
- God of War : 186 000+
- Super Smash Bros Ultimate : 135 600
- Assassin's Creed Odyssey : 104 000
- FIFA 19 (NSW) : 77 000
- NBA 2K19 (PS4) :70 500
*it is possible that the chart isn't 100% accurate since some games didn't get an update for quite some time
I archieved 57 SKUs last year, games that usually crossed 1000 on their first week but I am missing a significant amount of smaller games.
So FIFA 19 (NSW) is the #9 best selling 2018 SKU, it is doing better than 84% of the SKUs that sold above 1k first week, meaning that my estimate of 90-95% of all games released that year was pretty much spot on.
No worries. Thanks for the effort. Crazy the drop off from the top 2 games.


Australia and New Zealand:
Week 19, 2019 - All Formats (Units)
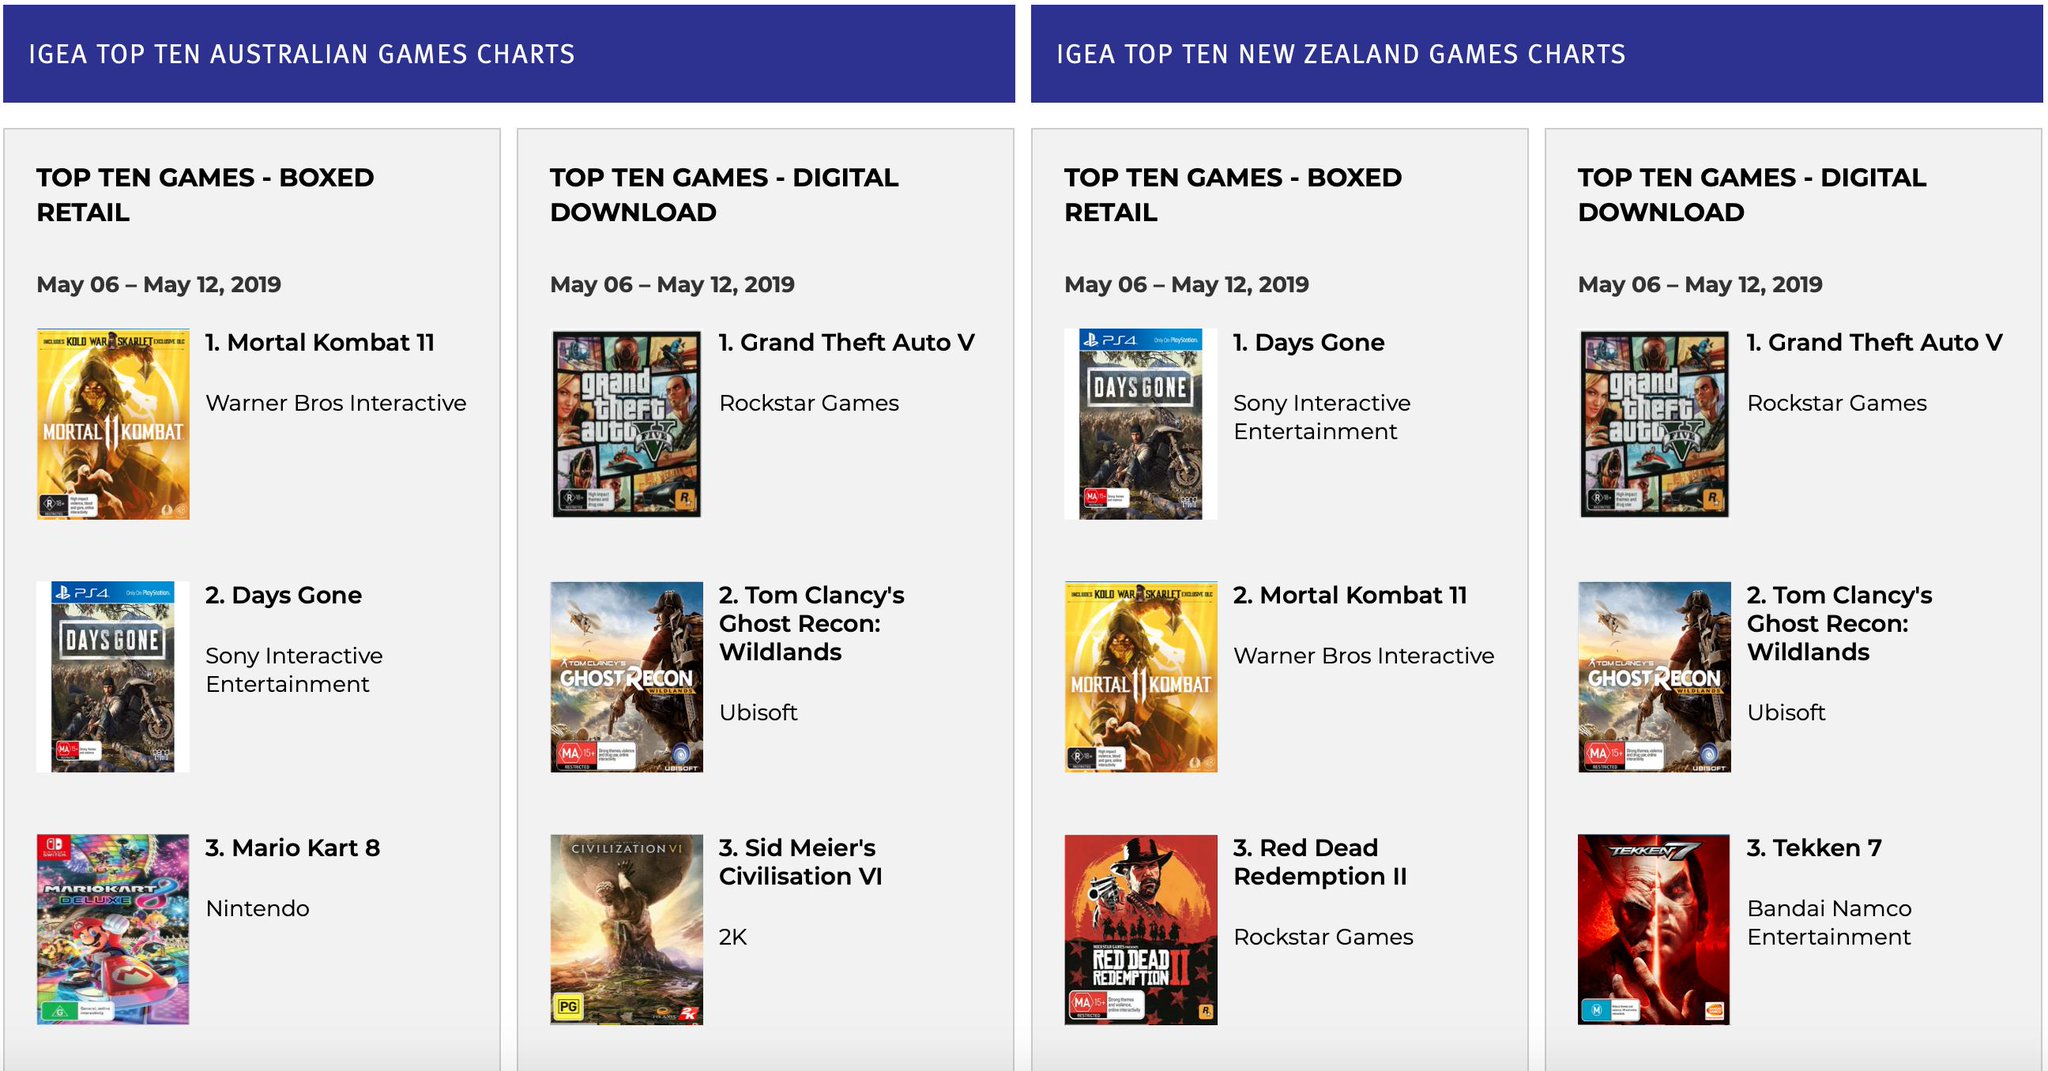
Wildlands reappears for the digital lists in the week GR Breakpoint was announced.
Spain:
Week 19, 2019 - Individual Formats Retail (Units) (Source: Vandal.net)
01 (06) Spider-Man PS4 - 4300 / 298.600
02 (01) Days Gone PS4 - 3700 / 42.300
03 (02) Mario Kart 8 Deluxe Switch - 3500 / 374.500
04 (--) Super Mario Party Switch - 2200 / 72.000
05 (05) Grand Theft Auto V PS4 - 2000 / 921.200
06 (--) Super Mario Odyssey Switch - 1700 / 349.900
07 (NE) Mortal Kombat 11 Switch - 1500 / NEW
08 (03) FIFA 19 PS4 - 1500 / 631.400
09 (07) Super Smash Bros. Ultimate Switch - 1400 / 137.000
10 (--) Minecraft Switch - 1200 / 15.600
Hardware
Switch: 12.000
PS4: 6.000
Xbox One: 800
Spain Sales, Week 18
Spain Sales - Vandal.net: Archive
Last edited:
Spain:
Week 19, 2019 - Individual Formats Retail (Units) (Source: Vandal.net)
01 (06) Spider-Man PS4 - 4300 / 298.600
02 (01) Days Gone PS4 - 3700 / 42.300
03 (02) Mario Kart 8 Deluxe Switch - 3500 / 374.500
04 (--) Super Mario Party Switch - 2200 / 72.000
05 (05) Grand Theft Auto V PS4 - 2000 / 921.200
06 (--) Super Mario Odyssey Switch - 1700 / 349.900
07 (NE) Mortal Kombat 11 Switch - 1500 / NEW
08 (03) FIFA 19 PS4 - 1500 / 631.400
09 (07) Super Smash Bros. Ultimate Switch - 1400 / 137.000
10 (--) Minecraft Switch - 1200 / 15.600
Hardware
Switch: 12.000
PS4: 6.000
Xbox One: 800
Yep, comunión in full effect.
That's a great debut for MK11 on Switch. XB1 did 850, PS4 6400 FW
Spain:
Week 19, 2019 - Individual Formats Retail (Units) (Source: Vandal.net)
01 (06) Spider-Man PS4 - 4300 / 298.600
02 (01) Days Gone PS4 - 3700 / 42.300
03 (02) Mario Kart 8 Deluxe Switch - 3500 / 374.500
04 (--) Super Mario Party Switch - 2200 / 72.000
05 (05) Grand Theft Auto V PS4 - 2000 / 921.200
06 (--) Super Mario Odyssey Switch - 1700 / 349.900
07 (NE) Mortal Kombat 11 Switch - 1500 / NEW
08 (03) FIFA 19 PS4 - 1500 / 631.400
09 (07) Super Smash Bros. Ultimate Switch - 1400 / 137.000
10 (--) Minecraft Switch - 1200 / 15.600
Hardware
Switch: 12.000
PS4: 6.000
Xbox One: 800
Nice increase for Spider-Man, some updated numbers would be nice Sony.
Spain:
Week 19, 2019 - Individual Formats Retail (Units) (Source: Vandal.net)
01 (06) Spider-Man PS4 - 4300 / 298.600
02 (01) Days Gone PS4 - 3700 / 42.300
03 (02) Mario Kart 8 Deluxe Switch - 3500 / 374.500
04 (--) Super Mario Party Switch - 2200 / 72.000
05 (05) Grand Theft Auto V PS4 - 2000 / 921.200
06 (--) Super Mario Odyssey Switch - 1700 / 349.900
07 (NE) Mortal Kombat 11 Switch - 1500 / NEW
08 (03) FIFA 19 PS4 - 1500 / 631.400
09 (07) Super Smash Bros. Ultimate Switch - 1400 / 137.000
10 (--) Minecraft Switch - 1200 / 15.600
Hardware
Switch: 12.000
PS4: 6.000
Xbox One: 800
Yoh Switch calm the fuck down lmao
Finally an update on Super Mario Party :)
Spain:
Week 19, 2019 - Individual Formats Retail (Units) (Source: Vandal.net)
01 (06) Spider-Man PS4 - 4300 / 298.600
02 (01) Days Gone PS4 - 3700 / 42.300
03 (02) Mario Kart 8 Deluxe Switch - 3500 / 374.500
04 (--) Super Mario Party Switch - 2200 / 72.000
05 (05) Grand Theft Auto V PS4 - 2000 / 921.200
06 (--) Super Mario Odyssey Switch - 1700 / 349.900
07 (NE) Mortal Kombat 11 Switch - 1500 / NEW
08 (03) FIFA 19 PS4 - 1500 / 631.400
09 (07) Super Smash Bros. Ultimate Switch - 1400 / 137.000
10 (--) Minecraft Switch - 1200 / 15.600
Hardware
Switch: 12.000
PS4: 6.000
Xbox One: 800
So that gives us,
Switch top 10 :
- Mario Kart 8 Deluxe : 374 500
- Super Mario Odyssey : 349 000
- Zelda Breath of the Wild : 258 000+
- Pokemon Let's Go : 189 000+
- Splatoon 2 : unknown LTD but 80k in 2018 alone
- Super Smash Bros Ultimate : 137 000
- Mario + Rabbids : unknown LTD but was at 65k during week 15,2018.
- FIFA 19 : 77 000
- Super Mario Party : 72 000
- Donkey Kong Country : Tropical Freeze : 57 000+
Spain:
Week 19, 2019 - Individual Formats Retail (Units) (Source: Vandal.net)
01 (06) Spider-Man PS4 - 4300 / 298.600
02 (01) Days Gone PS4 - 3700 / 42.300
03 (02) Mario Kart 8 Deluxe Switch - 3500 / 374.500
04 (--) Super Mario Party Switch - 2200 / 72.000
05 (05) Grand Theft Auto V PS4 - 2000 / 921.200
06 (--) Super Mario Odyssey Switch - 1700 / 349.900
07 (NE) Mortal Kombat 11 Switch - 1500 / NEW
08 (03) FIFA 19 PS4 - 1500 / 631.400
09 (07) Super Smash Bros. Ultimate Switch - 1400 / 137.000
10 (--) Minecraft Switch - 1200 / 15.600
Hardware
Switch: 12.000
PS4: 6.000
Xbox One: 800
Nothing better than celebrating a comunión playing Mortal Kombat.
I've compiled the hardware numbers for Spain (thanks to El Manco, tolkir and others for writing them up every week!). Note that numbers started in week 7, and week 8 is missing. That said, here's the result:
Total of the year (note that not all weeks of the year are included!):
Switch = 51,400
PS4 = 43,900
XB1 = 7,790
Weekly numbers:
I will try to add to this list every week, for as long as we get hardware data from Vandal.net.
Total of the year (note that not all weeks of the year are included!):
Switch = 51,400
PS4 = 43,900
XB1 = 7,790
Weekly numbers:
Code:
Week 7:
PS4: 3,600
NSW: 2,900
XBO: 450

Week 9:
PS4: 3,700
NSW: 2,500
XBO: 350

Week 10:
NSW: 3,200
PS4: 2,900
XBO: 390

Week 11:
PS4: 3,050
NSW: 2,650
XBO: 550

Week 12:
PS4: 3,150
NSW: 2,900
XBO: 600

Week 13:
NSW: 3 000
PS4: 2 500
XBO: 1 500

Week 14:
PS4: 3,900
NSW: 3,000
XBO: 1,200

Week 15:
PS4: 4,200
NSW: 3,400
XBO: 400

Week 16:
NSW: 4,600
PS4: 3,500
XBO: 400

Week 17:
NSW: 4,500
PS4: 4,000
XBO: 550

Week 18:
Switch: 7050
PS4: 3400
Xbox One: 600

Week 19:
Switch: 12.000
PS4: 6.000
Xbox One: 800
I will try to add to this list every week, for as long as we get hardware data from Vandal.net.
I've compiled the hardware numbers for Spain (thanks to El Manco, tolkir and others for writing them up every week!). Note that numbers started in week 7, and week 8 is missing. That said, here's the result:
Total of the year (note that not all weeks of the year are included!):
Switch = 51,400
PS4 = 43,900
XB1 = 7,790
Weekly numbers:
Code:Week 7: PS4: 3,600 NSW: 2,900 XBO: 450 Week 9: PS4: 3,700 NSW: 2,500 XBO: 350 Week 10: NSW: 3,200 PS4: 2,900 XBO: 390 Week 11: PS4: 3,050 NSW: 2,650 XBO: 550 Week 12: PS4: 3,150 NSW: 2,900 XBO: 600 Week 13: NSW: 3 000 PS4: 2 500 XBO: 1 500 Week 14: PS4: 3,900 NSW: 3,000 XBO: 1,200 Week 15: PS4: 4,200 NSW: 3,400 XBO: 400 Week 16: NSW: 4,600 PS4: 3,500 XBO: 400 Week 17: NSW: 4,500 PS4: 4,000 XBO: 550 Week 18: Switch: 7050 PS4: 3400 Xbox One: 600 Week 19: Switch: 12.000 PS4: 6.000 Xbox One: 800
I will try to add to this list every week, for as long as we get hardware data from Vandal.net.
Thanks for compiling this up!
Impressive Switch performance - during Wii U days this list would have looked vastly different.
Spain:
Week 19, 2019 - Individual Formats Retail (Units) (Source: Vandal.net)
01 (06) Spider-Man PS4 - 4300 / 298.600
02 (01) Days Gone PS4 - 3700 / 42.300
03 (02) Mario Kart 8 Deluxe Switch - 3500 / 374.500
04 (--) Super Mario Party Switch - 2200 / 72.000
05 (05) Grand Theft Auto V PS4 - 2000 / 921.200
06 (--) Super Mario Odyssey Switch - 1700 / 349.900
07 (NE) Mortal Kombat 11 Switch - 1500 / NEW
08 (03) FIFA 19 PS4 - 1500 / 631.400
09 (07) Super Smash Bros. Ultimate Switch - 1400 / 137.000
10 (--) Minecraft Switch - 1200 / 15.600
Hardware
Switch: 12.000
PS4: 6.000
Xbox One: 800
I didn't forget you :p
So here is a chart of the top 10 games that released in 2018 :
- FIFA 19 (PS4) : 629 000
- Red Dead Redemption 2 (PS4) : 407 000
- Spiderman : 294 300
- Call of Duty Black Ops 4 (PS4) : 249 000
- Pokemon Let's Go : 189 000+
- God of War : 186 000+
- Super Smash Bros Ultimate : 135 600
- Assassin's Creed Odyssey : 104 000
- FIFA 19 (NSW) : 77 000
- NBA 2K19 (PS4) :70 500
*it is possible that the chart isn't 100% accurate since some games didn't get an update for quite some time
I archieved 57 SKUs last year, games that usually crossed 1000 on their first week but I am missing a significant amount of smaller games.
So FIFA 19 (NSW) is the #9 best selling 2018 SKU, it is doing better than 84% of the SKUs that sold above 1k first week, meaning that my estimate of 90-95% of all games released that year was pretty much spot on.
Something seems off. According to the numbers posted this week Smash Ultimate is at 137k. In your list it's at 135k. It's difficult to believe in 4.5 months smash sold only 2k units. Someone has the wrong information here.
I believe he's listing games released in 2018 with ongoing sales up to the last data point available (which for Smash probably was up to week 18 of 2019, at least until the week 19 data arrived). The 1,400 units from week 19 add up to 137k, as expected.Something seems off. According to the numbers posted this week Smash Ultimate is at 137k. In your list it's at 135k. It's difficult to believe in 4.5 months smash sold only 2k units. Someone has the wrong information here.
Last edited:
Those were LTD figures of games that released in 2018, not the top best selling games of 2018.Something seems off. According to the numbers posted this week Smash Ultimate is at 137k. In your list it's at 135k. It's difficult to believe in 4.5 months smash sold only 2k units. Someone has the wrong information here.
I believe he's listing games released in 2018 with ongoing sales up to the last data point available (which for Smash probably was up to week 18 of 2019, at least the week 19 data arrived). The 1,400 units from week 19 add up to 137k, as expected.
That's confusing but okay.
Hi, I think adding last dates (year and week) when numbers were updated will make list easier to understand.Those were LTD figures of games that released in 2018, not the top best selling games of 2018.
For example, I imagine games like NBA 2K19 have not been updated in recent months.
Last edited:
so there's a holiday called comunion that forces people to buy nintendo stuff. wow
Do you say the same thing about Christmas or golden week?
so there's a holiday called comunion that forces people to buy nintendo stuff. wow
No, it's the religious christian celebration where kids aged 8-9 do the comunion and because of that they get presents from family and friends. Kids of that age are a bigger part of the Nintendo audience compared to other consoles and that's why portables/Nintendo always have huge increases.
Also Nintendo always increases marketing expenses here around these dates.
Hm?
I was joking lol
Sad but expected :(Those that voted below 20,000 units for Rage 2 are the winners of the poll.
Dang that really does suck.Those that voted below 20,000 units for Rage 2 are the winners of the poll.
Ouch.Those that voted below 20,000 units for Rage 2 are the winners of the poll.
Those that voted below 20,000 units for Rage 2 are the winners of the poll.
I "won" I guess. Doesn't feel rewarding. I remember when Dishonored 2 did around 50k and Wolf 2 around 30k and everybody screamed flop. Looks like it's only getting worse. There are barely any games hitting 100k anymore. Big games like MK11 and Sekiro can't even hit 50k...
I "won" I guess. Doesn't feel rewarding. I remember when Dishonored 2 did around 50k and Wolf 2 around 30k and everybody screamed flop. Looks like it's only getting worse. There are barely any games hitting 100k anymore. Big games like MK11 and Sekiro can't even hit 50k...
Well digital is taking part of the sales but yeah.
I did it!Those that voted below 20,000 units for Rage 2 are the winners of the poll.
......
😔
Ouch :/Those that voted below 20,000 units for Rage 2 are the winners of the poll.
I thought Rage 2 could do slightly above 20K. Guess not!
Yeah, "some"
How low is #40 going to be in the middle of May, and factor in how many units SoT was selling anyway.
Yeah, "some"
How low is #40 going to be in the middle of May, and factor in how many units SoT was selling anyway.
Yeah, "some"
How low is #40 going to be in the middle of May, and factor in how many units SoT was selling anyway.
Wel, I guess it's more than 2.