Note: M = Million (or rather 10^6)
4th Quarter Earnings Release: https://www.nintendo.co.jp/ir/pdf/2019/190425e.pdf
For the fiscal year ended March 31st, 2019:
Hardware sales units: https://www.nintendo.co.jp/ir/en/finance/hard_soft/index.html
Supplemental information:
https://www.nintendo.co.jp/ir/pdf/2019/190425_3e.pdf
Million-Seller Titles of Nintendo Products (this fiscal year):
Top selling title sales units as of March 31st, 2019:
https://www.nintendo.co.jp/ir/en/finance/software/index.html
4th Quarter Earnings Release: https://www.nintendo.co.jp/ir/pdf/2019/190425e.pdf
For the fiscal year ended March 31st, 2019:
Code:
+------------------------------------------------------------------------------------------+
|                 |  This Quarter | FY Cumulative          |FY3/19 Forecast|FY3/20 Forecast|
+------------------------------------------------------------------------------------------+
| Net Sales       |   ¥203,265M   | ¥1,200,560M   (~$10.7B)| ¥1,200,000M   | ¥1,250,000M   |
| Operating Income|    ¥29,672M   |  ¥249,701M    (~$2.23B)|   ¥225,000M   |   ¥260,000M   |
| Net Profit      |    ¥25,224M   |  ¥194,009M    (~$1.73B)|   ¥165,000M   |   ¥180,000M   |
+------------------------------------------------------------------------------------------+Capital Adequacy Ratio: 83.4%
Current Assets: 1,344,972¥ million
Current Liabilities: 245,009¥ million
Cash and deposits: 845,550¥ million
Shareholder's equity: 1,422,260¥ million
Inventories: 135,470¥ million
Current Assets: 1,344,972¥ million
Current Liabilities: 245,009¥ million
Cash and deposits: 845,550¥ million
Shareholder's equity: 1,422,260¥ million
Inventories: 135,470¥ million
Hardware sales units: https://www.nintendo.co.jp/ir/en/finance/hard_soft/index.html
Code:
+-------------------------------------------------------------------------------------------------+
|      Switch     |  This Quarter | FY Cumulative |      LTD      |FY3/19 Forecast|FY3/20 Forecast|
+-------------------------------------------------------------------------------------------------+
| Hardware (units)|      2.46M    |     16.95M    |     34.74M    |      17.0M    |      18.0M    |
| Software (units)|     23.91M    |    118.55M    |    187.52M    |     110.0M    |     125.0M    |
+-------------------------------------------------------------------------------------------------+
(Software sales units include both packaged and downloadable versions of software.)
###
+-------------------------------------------------------------------------------------------------+
|       3DS       |  This Quarter | FY Cumulative |      LTD      |FY3/19 Forecast|FY3/20 Forecast|
+-------------------------------------------------------------------------------------------------+
| Hardware (units)|      0.24M    |      2.55M    |     75.08M    |       2.6M    |       1.0M    |
| Software (units)|      2.14M    |     13.22M    |    378.12M    |      13.0M    |       5.0M    |
+-------------------------------------------------------------------------------------------------+
(Software sales units include both packaged and downloadable versions of software.)
###
+------------------------------------------------------------------------+
|                                       |  This Quarter  | FY Cumulative |
+------------------------------------------------------------------------+
| Smart devices, IP related income, etc.|    ¥12,624M    |   ¥46,008M    |
+------------------------------------------------------------------------+
(Includes income from smart-device content and royalty income.)Nintendo no longer lists the following which was showed Nintendo's share of Pokémon Go's earnings:
Share of profit of entities accounted for using equity method
The above is now combined with Other and it can no longer be determined how much earnings are made from Pokémon Go.
Share of profit of entities accounted for using equity method
The above is now combined with Other and it can no longer be determined how much earnings are made from Pokémon Go.
Supplemental information:
https://www.nintendo.co.jp/ir/pdf/2019/190425_3e.pdf
Code:
+--------------------------------------------------------------------------+
| | This Quarter | FY Cumulative |
+--------------------------------------------------------------------------+
| Proportion of overseas sales | 78.7% | 77.9% |
+--------------------------------------------------------------------------+
(※ Proportion of overseas(outside of Japan) sales to total sales)
+--------------------------------------------------------------------------+
| Proportion of hardware sales | 51.1% | 58.4% |
+--------------------------------------------------------------------------+
(※ Proportion of hardware(including accessories) sales to total
dedicated videogame platform sales)
+--------------------------------------------------------------------------+
| Proportion of first party software sales | 80.3% | 83.8% |
+--------------------------------------------------------------------------+
(※ Proportion of first-party software sales to total dedicated video
game software sales)
+--------------------------------------------------------------------------+
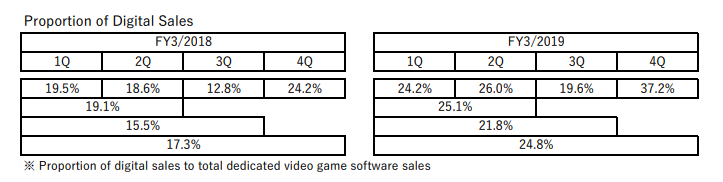
| Digital Sales | ¥34.6B | ¥118.8B |
+--------------------------------------------------------------------------+
(※ Digital sales include downloadable versions of packaged software,
download-only software, add-on content and Nintendo Switch Online.)
+--------------------------------------------------------------------------+
| Proportion of Digital Sales | 37.2% | 24.8% |
+--------------------------------------------------------------------------+
(※ Proportion of digital sales to total dedicated
video game software sales )
Code:
+--------------------------------------------------+
| Switch HW Shipments WW |    Units   | Percentage |
+--------------------------------------------------+
| Japan                  |    8.23M   |     24%    |
| The Americas           |   14.01M   |     40%    |
| Other                  |    12.5M   |     36%    |
+--------------------------------------------------+
###
+----------------------------------------------------------------+
| New Titles (Switch)    | This Quarter  | FY Cumulative |  LTD  |
+----------------------------------------------------------------+
| Japan                  |      53       |      215      |  298  |
| The Americas           |      68       |      280      |  385  |
| Other                  |      64       |      269      |  379  |
+----------------------------------------------------------------+
Million-Seller Titles of Nintendo Products (this fiscal year):
Code:
+-------------------------------------------------------------------------------------------------+
| Title                                   |  FY Japan   | FY Overseas |  FY Global  | Global LTD  |
+-------------------------------------------------------------------------------------------------+
| Donkey Kong Country: Tropical Freeze    |    0.29M    |    1.96M    |    2.25M    |    2.25M    |
| Mario Tennis Aces                       |    0.55M    |     2.09M    |    2.64M    |    2.64M    |
| Mario Kart 8 Deluxe                     |    0.89M    |    6.57M    |     7.47M    |   16.69M    |
| The Legend of Zelda: Breath of the Wild |    0.47M    |    3.83M    |    4.3M    |   12.77M    |
| Super Mario Oddysey                     |    0.34M    |    3.7M    |    4.04M    |   14.44M    |
| Splatoon 2                              |    0.83M    |    1.86M    |    2.69M    |    8.7M    |
| Octopath Traveler                       |     0.0M    |    1.17M    |    1.17M    |    1.17M    |
| Super Mario Party                       |    1.22M    |    5.18M    |     6.4M    |     6.4M    |
| Pokémon Let's Go Pikachu/Eevee          |    1.93M    |    8.7M    |    10.63M    |    10.63M    |
| Super Smash Bros. Ultimate              |    3.53M    |    10.28M    |   13.81M    |   13.81M    |
| Nintendo Labo Toy-Con 01: Variety Kit   |    0.33M    |    0.76M    |    1.09M    |    1.09M    |
| Captain Toad: Treasure Tracker          |    0.24M    |    0.94M    |    1.18M    |    1.18M    |
| Mario Kart 7 (3DS)                      |    0.07M    |     1.15M    |    1.21M    |   18.26M    |
| New Super Mario Bros. U Deluxe          |    0.69M    |     2.63M    |    3.31M    |   3.31M    |
| Kirby Star Allies                       |    0.36M    |     0.94M    |    1.3M    |   2.56M    |
| Yoshi's Crafted World                   |    0.14M    |     0.96M    |    1.11M    |   1.11M    |
+---------------------------------------------------------------------------------------------------+
Top selling title sales units as of March 31st, 2019:
https://www.nintendo.co.jp/ir/en/finance/software/index.html
Code:
+----------------------------------------------------------------------+
| Switch - Top Selling Titles (units)      | This Quarter|     LTD     |
+----------------------------------------------------------------------+
| Mario Kart 8 Deluxe                      |    1.67M    |   16.69M    |
| Super Mario Odyssey                      |    0.68M    |   14.44M    |
| Super Smash Bros. Ultimate               |   1.73M    |   13.81M    |
| The Legend of Zelda: Breath of the Wild  |     1.09M    |   12.77M    |
| Pokémon Let's Go Pikachu/Eevee           |    0.63M    |    10.63M    |
| Splatoon 2                               |     0.43M    |    8.7M    |
| Super Mario Party                        |     1.1M    |     6.4M    |
| New Super Mario Bros. U Deluxe             |    3.31M    |    3.31M    |
| 1-2-Switch                               |    0.11M    |    2.97M    |
| Mario Tennis Aces                        |    0.11M    |    2.64M    |
+----------------------------------------------------------------------+
###
+----------------------------------------------------------------------+
| 3DS - Top Selling Titles (units)         | This Quarter|     LTD     |
+----------------------------------------------------------------------+
| Mario Kart 7                             |    0.15M    |   18.26M    |
| Pokémon X/Y                              |    0.02M    |   16.39M    |
| Pokémon Sun/Moon                         |    0.01M    |   16.15M    |
| Pokémon Omega Ruby/Alpha Sapphire        |    0.02M    |   14.19M    |
| New Super Mario Bros. 2                  |    0.08M    |   13.16M    |
| Super Mario 3D Land                      |    0.09M    |   12.5M    |
| Animal Crossing: New Leaf                |    0.11M    |    12.21M    |
| Super Smash Bros. for Nintendo 3DS       |     0.04M    |    9.49M    |
| Pokémon Ultra Sun/Ultra Moon             |    0.09M    |    8.37M    |
| Tomodachi Life                           |     0.05M    |     6.45M    |
+----------------------------------------------------------------------+News:
Combined with steadily-growing sales of titles released during previous fiscal
years and titles released by other software publishers, the total number of million-seller titles during this fiscal year recorded 23.
Nintendo Entertainment System: NES Classic Edition
and Super Nintendo Entertainment System: Super NES Classic Edition recorded total sales of 5.95 million units.
Turning to our digital business for dedicated video game platforms, sales of download versions of packaged software and download-
only software for Nintendo Switch showed especially good growth, bringing digital sales to 118.8 billion yen (95.4% increase on a
year-on-year basis).
Last edited: