The coronavirus may still be spreading at epidemic rates in 24 states, particularly in the South and Midwest, according to new research that highlights the risk of a second wave of infections in places that reopen too quickly or without sufficient precautions. Researchers at Imperial College London created a model that incorporates cellphone data showing that people sharply reduced their movements after stay-at-home orders were broadly imposed in March. With restrictions now easing and mobility increasing with the approach of Memorial Day and the unofficial start of summer, the researchers developed an estimate of viral spread as of May 17.
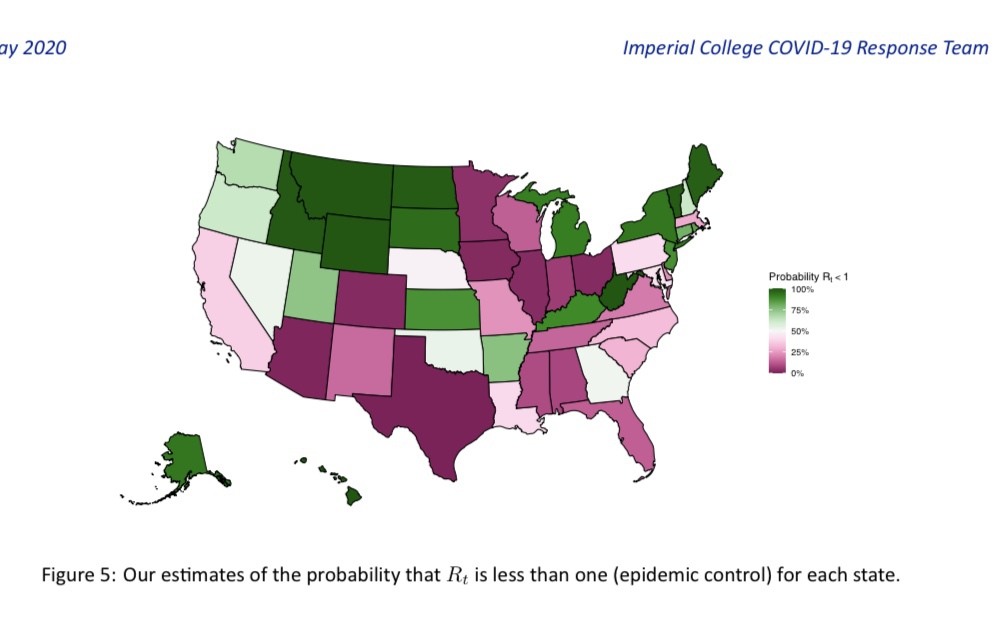
The Imperial College researchers estimated the virus's reproduction number, known as R0, or R naught. This is the average number of infections generated by each infected person in a vulnerable population. The researchers found the reproduction number has dropped below 1 in the District and 26 states. In those places, as of May 17, the epidemic was waning. In 24 states, however, the model shows a reproduction number over 1. Texas tops the list, followed by Arizona, Illinois, Colorado, Ohio, Minnesota, Indiana, Iowa, Alabama and Wisconsin.
When the R naught is below 1, it means the virus is hitting a lot of dead ends as it infects people. Someone who is infected but who follows social distancing rules or stays quarantined until recovering has a good chance of not infecting anyone else. The challenge is finding a way to reopen the economy with sufficient care to prevent the reproduction number from going over 1.
Political leaders have traded executive orders for appeals to individual responsibility and judgment. Even as they touted reopening water parks and beaches, some governors told their citizens not to enjoy their new freedoms too much.
In a hotspot in western Iowa, "families need to make their own decisions," said Matthew A. Ung, chair of Woodbury County's board of supervisors. "You don't have to act one way or another because of what the government says," he said. "Look out for you and your family."
R1 chart - ranked top to bottom from lowest [good] to highest [bad]. The triangles are the current R1, with the circles the estimates from back in March.
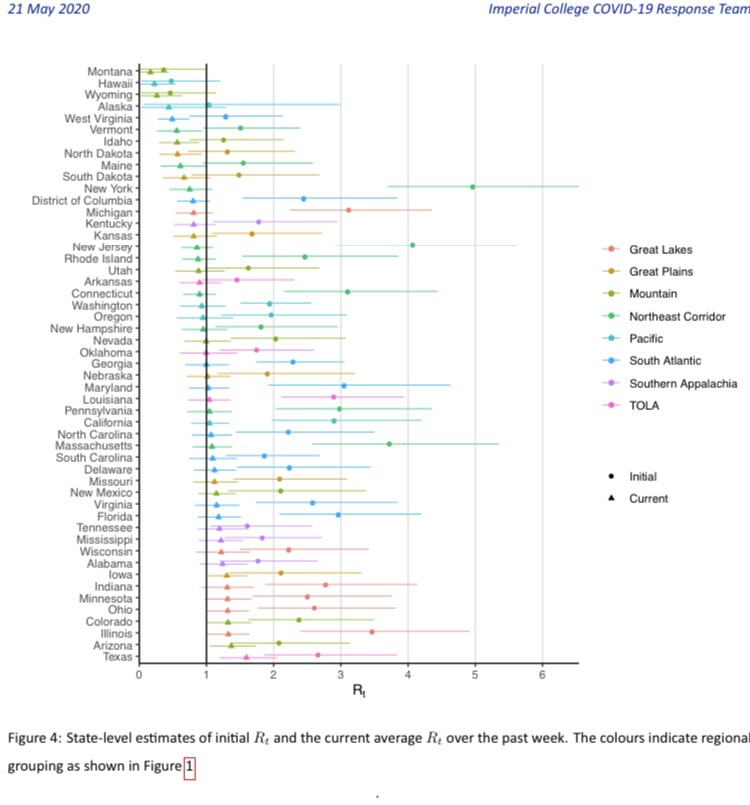
Texas is not looking good.
The study has some interesting time series graphs of movement in states, grouped by region, too.
Article:
Report:
https://www.imperial.ac.uk/media/imperial-college/medicine/mrc-gida/2020-05-21-COVID19-Report-23.pdf
Stay safe.